Data trending and visualization for process analysis
Process analysis to make decisions and solve problems
ProcessAnalyzer is an unparalleled software tool, used by managers, engineers, technicians and operators to quickly determine cause and effect of production quality issues. Evaluate machine performance for quality and process problems affecting mill operation and efficiency.
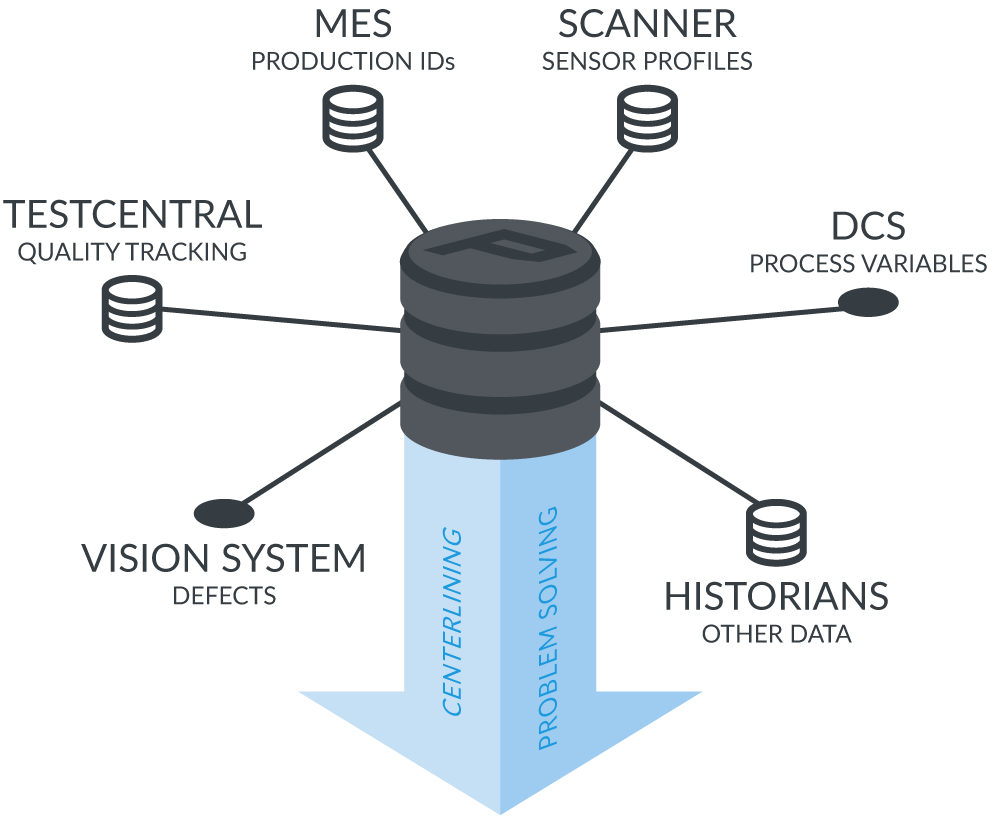
Capture data from sources such as continuous process variables, scanner quality profiles, discrete lab test data and events which occur at different times during production. Plot the data graphically on a contiguous timeline.
Not only will you be able to center-line conditions for making the highest quality product most efficiently, but ProcessAnalyzer makes finding elusive problems finally solvable.
Improving machine performance is trending
Many data sources
Data can be captured from various sources, including PantherQCS, third-party QCS, PLC, DCS, TestCentral Lab Systems, popular third-party historians, MillTools Production MES systems, and third-party MES systems. Web production and scanner data, lab data and process data are correlated to drive the graphical presentation of ProcessAnalyzer. Panther supplies a variety of interfaces to capture data, including OPC, discrete and automatic lab test devices, and third-party systems.
Process, profile and lab test trending
Process variables: are selected and trended across a multi-point recorder. It also can include profile averages, lab tests, and events to show a composite of diverse information.
Scanner profiles: are selected and plotted in 3D, 2D and 1D trending images. Lab test results based on reel turn-up and events, such as a grade or product change, are time inserted in these images. The Profile 1D/trending statistical data (averages) can also be plotted. “As shipped” flat roll maps can be overlaid in a 2D profile.
Lab tests: captured as single point or averages and plotted in upper and lower trend screens. The combination and processing of data types by ProcessAnalyzer removes the tedious guesswork, normalizing, and setup work that may be required by any other method of data comparison.
3D, 2D and trend plotting
Panther’s trend technology is used to draw the complex data sets in easy to read trend displays, including user defined color selection. Cross hair controls make it easy to grab specific data points and elements for viewing.
Zoom in and out
A powerful zoom in and out feature allows the user to zoom in on a suspected cause of a problem with just a click of the mouse.
Fast data retrieval
Unique Panther algorithms are used to quickly capture and display data graphically. The data can be captured by time period selection, by day, by roll number, by product, by process variable tags, by lab test name and by assigned events (such as a shift or product change).
Limits and events
As data is selected, limits such as test limits and product specifications are automatically displayed as well. Events related to production times are marked with a line on the trend.
Macro views
Trend “set-ups” of various data combinations can be stored as macros for quick data retrieval. For example, a user may want to capture and view results of a significant event such as the run of a specific product.
Equation builder
To enhance the ability to compare information, an equation builder allows a user to define unique graphical relationships of information not previously considered as related. Users can associate any data or event in the system, create mathematical relationships and even new events. As an example, a relationship between a lab test strength (single point) and a continuous freeness process variable can be defined.
Reporting and exporting
Displayed data has built-in reporting so important table information, such as profile statistics, can be shown and printed over the selected time period. The data sets can be exported to Excel for external macro user manipulation.
Trial runs
ProcessAnalyzer is excellent for trial runs and optimum benchmark performance, such as 100% product/grade efficiency periods. Important variables can be monitored during the run and the results used to assist in achieving duplication and product goals.
Multi-user license
ProcessAnalyzer is a client/server product. The base system consists of the application, historian and access for five users. Additional licensing is available for more than five users.


